
Creating the perfect infographic goes beyond compelling visuals and engaging content—it’s all about the right dimensions for each platform. That’s why we’ve put together the Ultimate Guide to Digital Infographic Sizes in 2024.
With so many platforms and use cases, understanding the ideal infographic sizes is crucial to ensure your designs look professional and grab attention. Whether you’re creating for social media, websites, or presentations, this guide will assist you in optimizing your infographics for maximum effect in 2024.
When it comes to digital content, the ability to convey information efficiently and engagingly is a must, and infographics have emerged as powerful tools to achieve just that.
However, the effectiveness of an infographic is directly tied to its presentation, and size plays a crucial role in ensuring the best visibility and engagement. Every online platform—from social media giants like Facebook and Twitter to email inboxes and blog spaces—has its unique set of sizing rules.
For your carefully crafted visuals to reach their intended audiences, mastering these dimensions is essential.
This ultimate guide will delve into the specific requirements for various digital platforms, giving you the knowledge you need to enhance infographics across various digital platforms.
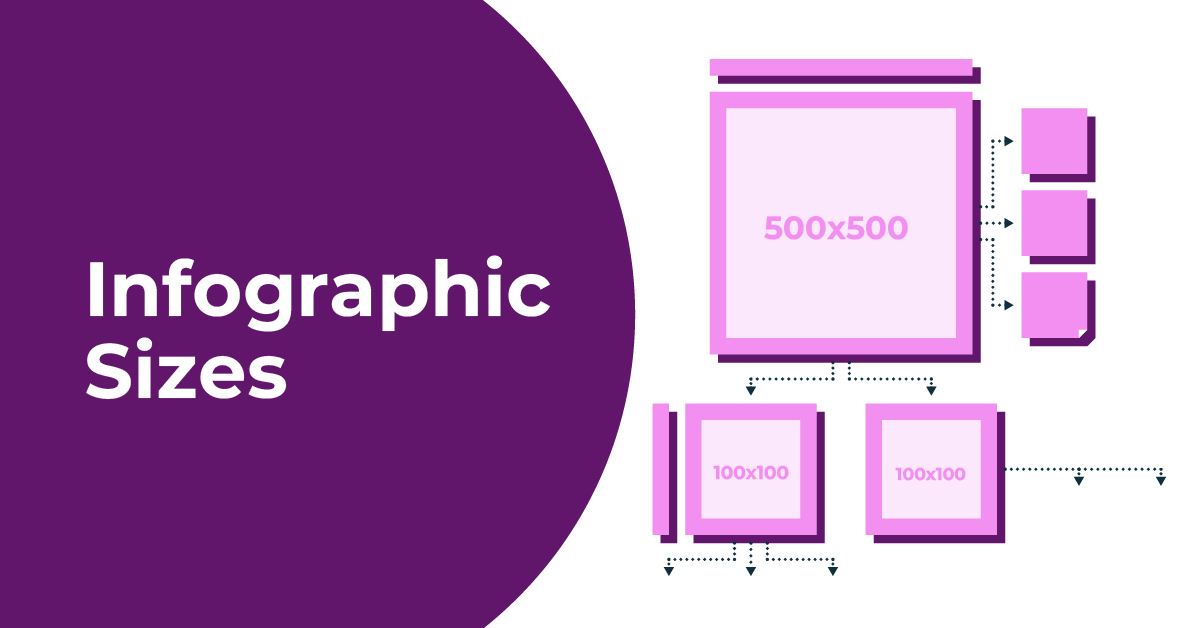
Standard Infographic Sizes
Infographics are powerful tools for conveying information in a visually appealing and digestible manner. To ensure your infographics are displayed optimally across various platforms, it’s crucial to be mindful of the size requirements.
The standard infographic size is 600 pixels wide by 1200 pixels tall, providing a balanced and versatile layout.
Infographic Sizes for Different Platforms
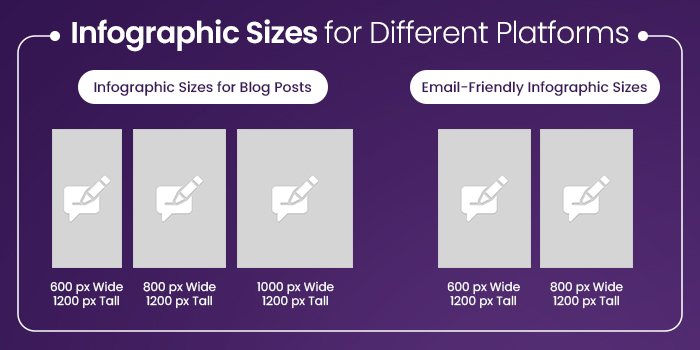
Infographic Sizes for Blog Posts
- 600 px Wide x 1200 px Tall: This is the standard size suitable for most blog layouts.
- 800 px Wide x 1200 px Tall: Some blog themes may benefit from a wider display, offering a more immersive experience.
- 1000 px Wide x 1200 px Tall: Ideal for blogs with wider content areas or for emphasis on visual elements.
Email-Friendly Infographic Sizes
- 600 px Wide x 900 px Tall: Tailored for email displays, ensuring your infographic fits neatly without compromising clarity.
- 800 px Wide x 1200 px Tall: A larger size suitable for emails with more expansive layouts or when a detailed view is necessary.
Confused between so many sizing options? Don’t worry.
Design Shifu, your ultimate partner in unlimited graphic design, ensures your visuals are tailor-made for every platform’s unique sizing requirements. Elevate your content game with our dedicated designers, 24/7 support, and unlimited infographics—all starting at just $199 per month. Subscribe now and experience unlimited graphic designs at its best.
Digital Infographic Sizes for Social Media
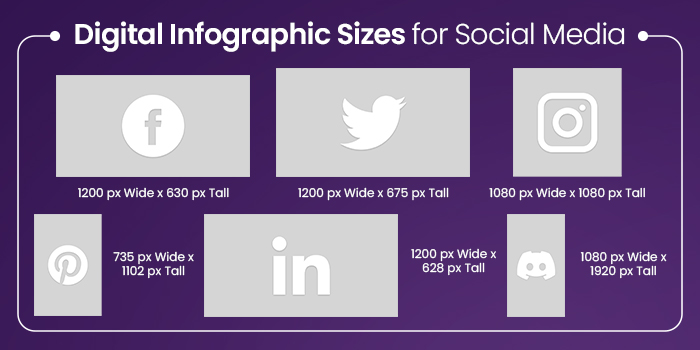
Infographic Sizes for Facebook
1200 px Wide x 630 px Tall: Optimal size for Facebook posts, balancing visibility and engagement.
Infographic Sizes for Twitter
1200 px Wide x 675 px Tall: Twitter’s landscape layout accommodates this size well, ensuring your infographic stands out in the feed.
Infographic Sizes for Instagram
1080 px Wide x 1080 px Tall: Square dimensions work best for Instagram, creating a visually appealing presence on the platform.
Infographic Sizes for Pinterest
735 px Wide x 1102 px Tall: The vertical orientation suits Pinterest’s layout, maximizing visibility in user feeds.
Infographic Sizes for LinkedIn
1200 px Wide x 628 px Tall: Ideal for professional content sharing on LinkedIn, maintaining clarity and professionalism.
Infographic Sizes for Discord
1080 px Wide x 1920 px Tall: Discord’s layout benefits from a taller infographic, ensuring information is displayed cohesively.
Frequently Asked Questions
The standard size for an infographic is 600 pixels wide by 1200 pixels tall. This size provides a balanced and versatile layout suitable for various platforms.
Infographic sizes for print can vary based on the intended use. However, a common recommendation is to design print infographics at a higher resolution, such as 300 dots per inch (DPI), to ensure clarity. The physical size can depend on your specific printing requirements.
Canva provides flexibility in choosing your infographic dimensions. While there isn’t a fixed size, the standard dimensions mentioned earlier (600 px by 1200 px) can be easily customized within Canva’s platform.
The best format for infographics is typically a high-quality image format, such as PNG or JPEG. These formats ensure good image quality while keeping file sizes manageable. Additionally, consider the purpose—whether it’s for web, print, or social media—and adjust the format accordingly.
Adobe After Effects: Offers advanced features for animation and motion graphics.
Vyond: Ideal for creating animated explainer videos.
Animaker: Provides a user-friendly interface for creating animated infographics.
Visual.ly: A platform for discovering and sharing infographics.
Pinterest: A visual discovery platform with a vast collection of infographics.
Behance: A platform where designers showcase their portfolios, including infographics.
The time it takes to create an infographic can vary based on complexity, design elements, and the tools used.