small business design Archives - Design Shifu

Affordable Design Systems for One-Person Brands

Think professional branding is out of reach for one-person businesses? Think again. In a crowded digital space, design is your first impression—and the right tools can make it powerful without breaking the bank. 

Whether you’re a freelancer, consultant, or small business owner, discover how to elevate your brand affordably and efficiently.

This blog explores the top affordable design systems for one-person brands, guiding you to the best tools to purchase or subscribe to for a polished, cohesive brand presence. 

TL;DR

  • Solopreneurs can build professional brands on a budget by using affordable design systems like Canva Pro, Figma, or Webpixels. 
  • These tools save time, ensure brand consistency, and deliver strong ROI.

Why Invest in Affordable Design Systems?

For one-person brands, a design system is a game-changer. These collections of reusable components—like logos, typography, and templates—ensure your brand looks professional across platforms.

Here’s why these systems are a smart investment for solo brands

  • Cost Savings: Avoid expensive freelancers with low-cost or free tools.
  • Brand Consistency: Maintain a unified look on your website, social media, and marketing materials.
  • Time Efficiency: Pre-built components speed up design tasks, letting you focus on growing your business.

With a commercial mindset, choosing the right system means prioritizing tools that deliver high ROI and scalability. These benefits compound over time—especially when your visual presence consistently reinforces your brand identity

Top Affordable Design Tools for Solopreneurs

Agencies implementing inclusive Affordable Design Systems to Buy or Subscribe to, So that you make the right buy, we have collected the most effective affordable design systems for solopreneur brands. The solutions provide advanced features at lower costs, ideal for solopreneurs.

1. Canva Pro

Canva Pro ($12.99/month or $119.99/year) offers a powerful design system with brand kits, templates, and professional editing features.

  • Why Buy: Get access to thousands of editable templates, fonts, and a brand kit to save your logo and colors.
  • Best For: New designers looking for an all-in-one design solution.
  • Commercial Value: Increases productivity for making social media posts, presentations, and print materials.

2. Figma Professional Plan

Figma’s Professional Plan ($20/month) unlocks advanced design systems from the Figma Community, such as UI kits and style guides.

  • Why Buy: Shared features and reusable components for websites and apps.
  • Best For: Design-savvy solopreneurs who need scalable systems.
  • Commercial Value: Great for producing professional-grade digital products.

3. Webpixels Design System

Webpixels provides a Bootstrap-based system ($59/ year or $129/year for premium bundles) with responsive components and icons

  • Why Buy: Developer-friendly, with CSS and Figma support for websites and apps.
  • Best For: Solopreneurs with coding expertise.
  • Commercial Value: One-time payment provides long-term value for several projects.

4. DotYeti Graphic Design Subscription

DotYeti ($449/month) offers unlimited graphic design, including a custom design system specifically designed to fit your brand.

  • Why Buy: Personal designer crafts logos, social media graphics, and website graphics.
  • Best For: Busy solopreneurs who require hands-off design assistance.
  • Commercial Value: Personalized, high-quality designs are worth the cost for high-end brands.

5. Creative Market UI Kits

Creative Market provides budget-friendly UI kits and design systems (from $9.95) for Figma, Sketch, and Adobe XD.

  • Why Buy: Professionally crafted pieces for websites, apps, and branding.
  • Best For: Solopreneurs seeking high-end templates without subscriptionsClosest match: subscriptions.
  • Commercial Value: Budget-friendly for producing refined digital assets.

These budget-friendly design systems for solo brands offer great value, making them wise investments for solopreneurs.

How to Choose the Best Design System for Your Brand

Choosing the best tool starts with aligning features to your business needs and design skills.

Follow these steps

  • Identify Your Goals: Need social media graphics? Choose Canva. Building a website? Opt for Webpixels or Figma.
  • Evaluate Budget: One-time purchases (e.g., Webpixels, Creative Market) suit tight budgets, while subscriptions (e.g., DotYeti) offer ongoing support.
  • Check Ease of Use: Beginners should prioritize intuitive platforms like Canva, while advanced users can leverage Figma.
  • Ensure Scalability: Pick systems that grow with your brand, like Figma or Webpixels, for long-term value.
  • Look for integrations with platforms you already use (such as Shopify, Notion, or WordPress)

By focusing on commercial outcomes, you’ll invest in a system that drives sales and brand recognition.

Benefits of Affordable Design Systems for Solopreneurs

Purchasing affordable design systems for one-person brands delivers measurable benefits for your business

  • Increased Sales: Professional visuals attract customers and boost conversions.
  • Brand Authority: Consistent design builds trust and reinforces professionalism
  • Time Savings: Ready-made components cut design time, letting you focus on marketing and sales.
  • Competitive Edge: Stand out in crowded markets with polished, cohesive branding.

For example, a consultant using Canva Pro can create client presentations and social media posts in hours, not days, driving faster revenue growth.

Avoid These Costly Mistakes

When investing in affordable design systems for one-person brands, avoid these pitfalls to maximize your purchase

  • Overbuying: Avoid high-complexity tools like Figma unless you’re ready to invest time learning them
  • Ignoring Customization: Generic templates dilute your brand; tailor them to your identity.
  • Overlooking Updates: Ensure your system receives regular updates to stay compatible with new platforms.
  • Not Testing: Preview designs on multiple devices to ensure consistency.

By steering clear of these errors, you’ll get the most ROI from your affordable design system for one-person brands.

How to Implement Your Design System for Maximum Impact

Once you’ve purchased an affordable design system for one-person brands, follow these steps to integrate it into your workflow

  1. Set Up Your Brand Assets: Upload logos, colors, and fonts to the system’s brand kit (e.g., Canva Pro’s Brand Hub).
  2. Design Key Materials: Create business cards, website banners, and social media posts using system components.
  3. Optimize for Platforms: Ensure designs are responsive for mobile, desktop, and print.
  4. Track Performance: Use analytics (e.g., social media insights) to refine designs for better engagement.
  5. Build a swipe file of design inspiration to speed up future requests.

For instance, with Webpixels, you can build a responsive website in days, then repurpose its components for Instagram ads, maximizing your investment.

Balancing Cost and Quality

Many solopreneurs hesitate to invest in budget tools, fearing they compromise quality—but today’s design systems prove otherwise. Nevertheless, applications such as Canva Pro and Creative Market provide professional work at economical costs. 

Consider:

  • Support and Updates: Opt for systems that have active communities or customer support (e.g., Figma).
  • Flexibility: Select customizable systems in order to match your brand’s special style.
  • Trial Options: Test free versions (e.g., Canva’s free tier) before committing to paid plans.

By prioritizing these factors, you’ll achieve premium branding without overspending.

Checklist: What to Look for in a Design System

  • Aligns with your design goals (social, web, branding, etc.)
  • Offers one-time pricing or trial period
  • Scales with your business
  • Includes template libraries and reusable components
  • Supports consistent branding across platforms
  • Is easy to use or well-documented

Conclusion

Affordable design systems for one-person brands are essential investments for solopreneurs aiming to build a professional, profitable brand. From Canva Pro’s versatility to DotYeti’s personalized service, these tools deliver high-impact designs at low costs. 

By choosing the right system, avoiding common mistakes, and implementing it strategically, you’ll create a cohesive brand that drives sales and growth. Explore these tools today and build a visual brand that looks as professional as the value you offer

FAQs

1. What are affordable design systems for one-person brands?
They are budget-friendly tools or subscriptions, like Canva Pro or Webpixels, offering reusable design components to create consistent, professional visuals for solopreneurs.

2. Why should I buy an affordable design system for my brand?
These systems save time, reduce costs, and deliver professional designs that boost sales and credibility, giving your one-person brand a competitive edge.

3. Which affordable design system is best for beginners?
Canva Pro is ideal for beginners, offering an intuitive interface, affordable pricing ($12.99/month), and extensive templates for quick branding.

4. Are one-time purchase design systems worth it?
Yes, systems like Webpixels ($49 one-time) provide long-term value, especially for solopreneurs building websites or apps with reusable components.

5. How do affordable design systems increase sales?
Professional, consistent visuals attract customers, build trust, and improve conversions, directly impacting your revenue.

6. Can I try affordable design systems before buying?
Many systems, like Canva and Figma, offer free tiers or trials, letting you test features before investing in paid plans.

16 Infographic Design Ideas and Examples for Your Small Business

Seeking some innovative ways to display your small business data? Check out these 16 infographic design ideas and examples for your small business that can clearly communicate intricate information in a visually appealing manner.

Infographics not just make your content easier to digest but also facilitate increased engagement from your audience. Whether you are marketing a product, describing services, or revealing industry insights, these design ideas will surely wow you!

As we enter 2025, infographics are emerging as one of the powerful tools reshaping the way information is conveyed. 

As attention spans shorten and the demand for visually compelling content rises, the art of infographic design has gained unprecedented momentum. 

From converting complex data into digestible visual narratives to catering to the diverse needs of small businesses, infographics have become indispensable in marketing and communication.

This surge in popularity is driven by their ability to capture attention, present information with clarity, and align seamlessly with the fast-paced nature of modern content consumption. 

When visual storytelling has become bigger than ever, the intersection of design and data has brought infographics to the forefront, making them an indispensable resource for every marketing collateral, including presentation decks, social media creatives, brochures, and blog images.

Owing to the above notion, let’s jump to the blog that will help you design exceptional infographics in 2025.

Elements of a Successful Infographic Design in 2025

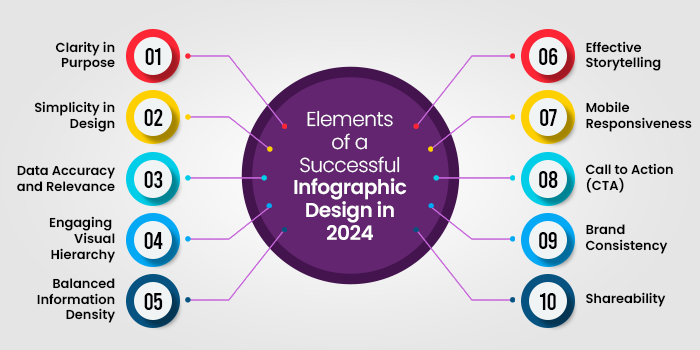
Elements of a Successful Infographic Design in 2024

Creating a successful infographic involves a thoughtful combination of design, data, and clarity to effectively convey information.

Clarity in Purpose

Define a clear purpose for your infographic. Whether it’s presenting statistics, explaining a process, or comparing data, a focused goal ensures your audience grasps the main message. For instance, an infographic titled “Evolution of Smartphones” should distinctly illustrate the progression of mobile technology over the years.

Simplicity in Design

Opt for a clean and simple design that enhances understanding. Use a cohesive color scheme, legible fonts, and appropriate visuals. An example could be an infographic depicting “Global Climate Change,” where a color gradient represents temperature variations, and clear icons symbolize environmental factors.

Data Accuracy and Relevance

Ensure the data presented is accurate and directly supports your narrative. A “Health Benefits of Exercise” infographic, for instance, should incorporate reliable statistics on how physical activity positively impacts various aspects of well-being.

Engaging Visual Hierarchy

Arrange elements in a logical order, guiding the viewer through the information flow. In an infographic about “The Solar System,” arranging planets by size or distance from the sun provides a natural visual hierarchy, aiding comprehension.

Balanced Information Density

Avoid information overload by presenting key points concisely. For an infographic on “Internet Usage Trends,” focus on highlighting the most relevant statistics, such as global internet penetration rates or popular online activities.

Effective Storytelling

Infographics should tell a story or convey a narrative. “The History of Photography” could follow a chronological sequence, showcasing key milestones with corresponding images to create a compelling visual journey.

Mobile Responsiveness

Design with various devices in mind, ensuring accessibility on both desktop and mobile screens. An infographic on “Smartphone Usage Statistics” should be easily navigable and retain its visual appeal on smaller screens.

Call to Action (CTA)

Encourage further engagement by including a clear CTA. For example, an infographic about “Reducing Carbon Footprint” might conclude with a call to action, urging viewers to adopt eco-friendly practices in their daily lives.

Brand Consistency

Maintain consistency with your brand elements, such as colors and logos. If creating an infographic for a company’s annual report, align the design with the established brand identity for a cohesive presentation.

Shareability

Enhance the infographic’s shareability by optimizing it for social media platforms. Consider the dimensions and content to make it easily shareable, fostering a wider reach for topics like “Top Social Media Trends.”

By incorporating these elements, you can craft an infographic that not only captures attention but effectively communicates your message to a diverse audience.

Types of Infographics Suitable for Small Businesses

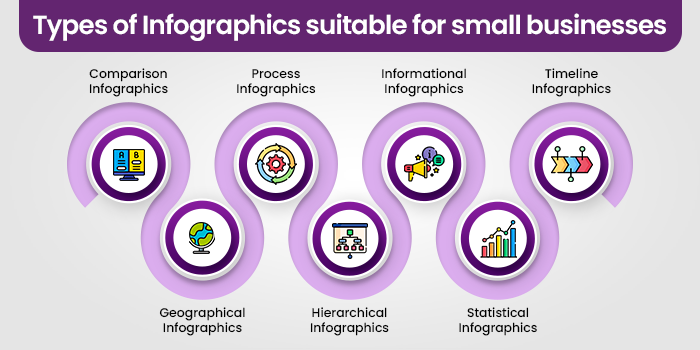
Infographics, versatile visual tools, come in various types, each serving a unique purpose in conveying information effectively.

Comparison Infographics

Source

Comparison infographics highlight the differences or similarities between items, options, or concepts. Side-by-side visual representations make it easy for audiences to grasp distinctions. Businesses use these infographics for product comparisons, feature analyses, or decision-making guides.

Geographical Infographics

Source

Geographical infographics utilize maps and visual elements to convey location-based information. Ideal for presenting regional data, demographics, or distribution patterns, these infographics are common in marketing, demographics studies, and travel-related content.

Finding this overwhelming? Why not get help from infographic design experts? At Design Shifu, we understand that the world of infographics can be vast and intricate, especially for small businesses juggling various priorities. 

Our unlimited graphic design subscription, starting at just $399 per month, not only simplifies the process but ensures that your infographics, be it for presentations, marketing materials, or social media, are not just visually appealing but also strategically crafted to convey your message effectively. Feel the weight lifted off your shoulders and book a demo today to explore how Design Shifu can be your trusted partner in turning complexity into captivating visuals.

Process Infographics

Source

Process infographics break down complex procedures or workflows into easy-to-follow steps. Flowcharts and diagrams simplify intricate processes, aiding comprehension. Businesses often use these infographics to explain workflows, project plans, or procedural guidelines.

Hierarchical Infographics

Source

Hierarchical infographics illustrate structures, rankings, or relationships between components in a system. Organizational charts and mind maps fall under this category, aiding in understanding hierarchical relationships in businesses, academic subjects, or project structures.

Informational Infographics

Source

Informational infographics present facts and details on a specific topic. They combine text with visuals to enhance understanding. Frequently used in educational materials, news articles, or blog posts, these infographics communicate information concisely and engage the audience.

Statistical Infographics

Source

Statistical infographics, or charts and graphs, are ideal for presenting numerical data. Bar graphs, pie charts, and line graphs visually represent statistics, making comparisons and trends easily discernible. Use them in reports, presentations, or articles where quantitative information needs to be highlighted.

Timeline Infographics

Source

Timelines organize events chronologically, offering a historical or sequential overview. These infographics are valuable for showcasing project timelines, historical developments, or biographical information. They provide a clear visual narrative of events unfolding over time.

Infographic Design Ideas to Communicate Effectively

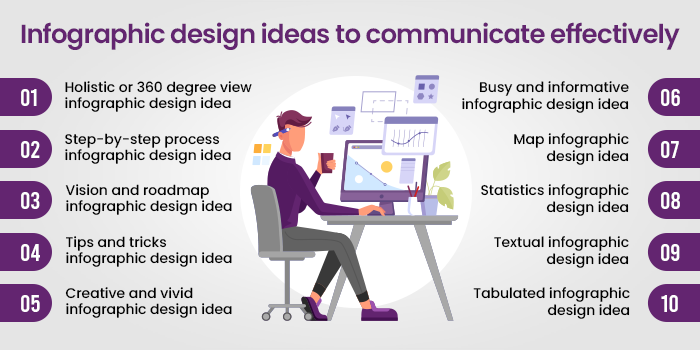
Infographic Design Ideas to Communicate Effectively

Holistic or 360-degree view infographic design idea

Source

This infographic adopts a Bird’s Eye View perspective, providing a comprehensive overview of a subject or topic. In this example, it’s used for a portfolio of an individual, the same could be used for the business while designing presentations as well.

With a captivating iconography, it efficiently communicates the broader context of the information, ideal for strategic planning, corporate summaries, or any content where a holistic understanding is crucial.

Step-by-step process infographic design idea

Source

The Step-by-Step guide infographic is perfect for leading audiences through a sequential flow of information. Here, the infographic is an ultimate guide in itself when it comes to app development. This infographic idea is successful in balancing text and icons perfectly.

The design is effective for instructional content, procedural guides, or any information that requires a clear and organized presentation of steps to follow.

Vision and roadmap infographic design idea

Source

This visionary infographic design illustrates a Roadmap, offering a clear trajectory for the future. Incorporating a timeline format, it’s excellent for business plans, project timelines, or any content where outlining future goals and milestones is essential. The use of clouds, boats, parks, etc., make it stand out while simultaneously conveying the required information.

Tips and tricks for infographic design idea

Source

This Tips and Tricks infographic design is an engaging way to share valuable insights or advice. Utilizing visually appealing icons and concise text, it’s well-suited for sharing quick, actionable tips. 

This design is effective for content related to life hacks, productivity tips, or educational quick guides.

Creative and vivid infographic design idea

Source

This infographic design bursts with color and innovative visual elements. This style is perfect for capturing attention and conveying imaginative concepts. The infographic is Ideal for showcasing creative projects, artistic processes, or any content where a vibrant and dynamic presentation is desired.

Though it does not capture much textual information but conveys context through thoughtful and creative visuals. If you want to design a minimal infographic for your small business, you can use it.

Busy and informative infographic design idea

Source

Most people would find this infographic to be too much, but the amount of information it’s carrying is impeccable. It’s not always advisable to fill the infographic with so much text, but if it’s necessary, this is a great infographic design idea to draw inspiration from.

It can further be used for data-heavy content such as market trends, statistical analyses, or any topic that requires a comprehensive yet organized display of information.

Map infographic design idea

Source

If you have several offline stores and want to display the same on your website or presentation deck, this is the best way to display it.

The infographic in the above example creatively incorporates geographic elements to convey information spatially. This design is ideal for presenting regional data, demographic trends, or location-specific details, providing a visually appealing and informative way to present geographic information.

Statistics infographic design idea

Source

When you have loads of data to display, use something like the above example. This infographic example effectively communicates numerical information through charts, graphs, and visual elements. This is perfect for annual reports, research findings, or any content where statistical data plays a key role.

Textual infographic design idea

Source

This Text-Rich infographic design strikes a balance between visuals and detailed information. It’s suitable for content that requires in-depth explanations, industry analyses, or textual content that benefits from visual enhancement. The design in the example keeps the audience engaged with a harmonious blend of text and visuals.

Tabulated infographic design idea

Source

Tables have always been a great medium to showcase information in an organized way. That’s the reason, when you incorporate a table in the infographic, you get the best of both worlds. 

The design in the example is excellent for comparative data, feature comparisons, or any content where a systematic arrangement of details is essential. The tabulated layout ensures clarity and easy comprehension of information.

Partner with Design Shifu and get your infographics delivered at a lightning-fast speed

Come aboard with Design Shifu, where expertise meets innovation for your infographic needs. Our skilled designers are well-versed in the art of crafting visually compelling infographics that resonate with your audience. 

With same-day delivery, unlimited revisions, and a dedicated designer, we bring efficiency to the creative process. Book a demo to witness the seamless integration of expertise and speed with Design Shifu.

Frequently Asked Questions

What are infographics and why do small businesses need them?

Infographics are visual depictions of data or information. They present intricate data in an easy-to-read and interesting way, which is particularly useful for small businesses aiming to grab people’s attention and enhance communication.

How do I make a great infographic for my business?

To design a successful infographic, prioritize clarity of purpose, simplicity of design, accuracy of data, and compelling visuals. Make sure your infographic is a good story, logically structured, and optimized for mobile consumption.

What are the best infographics for small businesses?

Types of infographics that work well for small businesses include comparison infographics, process infographics, statistical infographics, and timeline infographics. These formats help in conveying information clearly, whether you’re comparing products or showcasing a process.

Can infographics help boost engagement on social media?

Yes, infographics are extremely shareable on social media. They receive more engagement because of their visually engaging mode and capacity to make complex information simple. Infographics created with clear communication and shareable material can increase visibility and reach

How do infographics contribute to marketing and communication for small businesses?

Infographics assist in breaking down complex information and delivering it in an interesting, easy-to-grasp format. They grab attention instantly, aid in brand recall, and are shareable, thus making them a great marketing and communication tool.